
.gif)


 O'zbekcha
 Русский
 English
 中文
中文

Survey Results
INFORMATION on the results of the survey conducted among students of Gulistan State University for consideration at University Council Meeting No. 2 in September of the 2026/2027 academic year
General Information on the Survey of Gulistan State University Students
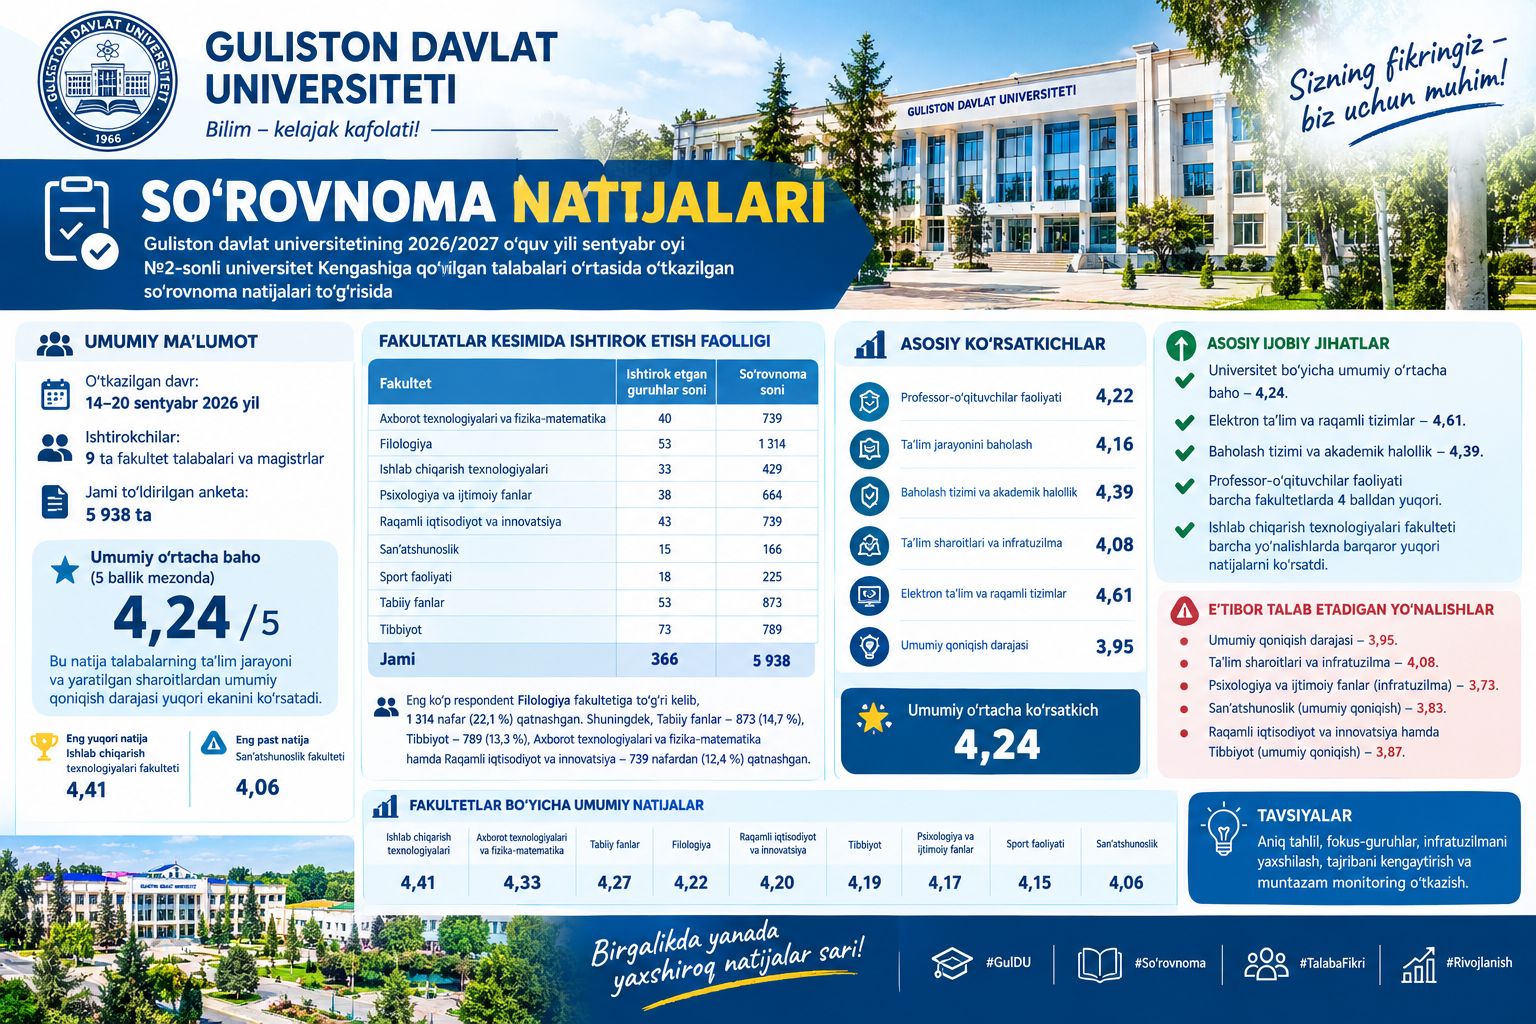
A university-wide survey was conducted from September 14 to 20, 2026, to assess students’ satisfaction with the educational process, the performance of academic staff, the assessment system, educational infrastructure, electronic learning services, and overall study conditions at Gulistan State University.
Students and master’s degree students from all nine faculties participated in the survey. A total of 5,938 questionnaires were completed.
According to the survey results, the university’s overall average score was 4.24 out of 5. This indicates a relatively high level of overall satisfaction among students and master’s degree students with the educational process and the conditions provided by the university.
Among the faculties, the Faculty of Production Technologies achieved the highest overall score of 4.41, while the Faculty of Arts Studies recorded the lowest score of 4.06.
Analysis of Survey Participation
| Faculty | Number of participating groups | Number of questionnaires |
|---|---|---|
| Faculty of Information Technology and Physics and Mathematics | 40 | 739 |
| Faculty of Philology | 53 | 1,314 |
| Faculty of Production Technologies | 33 | 429 |
| Faculty of Psychology and Social Sciences | 38 | 664 |
| Faculty of Digital Economy and Innovation | 43 | 739 |
| Faculty of Arts Studies | 15 | 166 |
| Faculty of Sports Activities | 18 | 225 |
| Faculty of Natural Sciences | 53 | 873 |
| Faculty of Medicine | 73 | 789 |
| Total | 366 | 5,938 |
The Faculty of Philology had the largest number of respondents, with 1,314 participants, accounting for 22.1% of all responses. The Faculty of Natural Sciences had 873 respondents (14.7%), the Faculty of Medicine had 789 (13.3%), and the Faculties of Information Technology and Physics and Mathematics and Digital Economy and Innovation each had 739 respondents (12.4%).
Analysis of the University’s Main Indicators
| Assessment area | University average score |
|---|---|
| Performance of academic staff | 4.22 |
| Assessment of the educational process | 4.16 |
| Assessment system and academic integrity | 4.39 |
| Learning conditions and infrastructure | 4.08 |
| E-learning and digital systems | 4.61 |
| Overall satisfaction level | 3.95 |
| Overall average score | 4.24 |
The results show that students gave the highest rating to “E-learning and Digital Systems,” with a score of 4.61.
The lowest score was recorded for “Overall Satisfaction Level,” at 3.95.
Assessment of Academic Staff Performance
The university-wide average rating of academic staff performance was 4.22.
The highest score was recorded by the Faculty of Production Technologies, at 4.43. This was followed by the Faculty of Information Technology and Physics and Mathematics at 4.31, the Faculty of Natural Sciences at 4.27, and the Faculty of Psychology and Social Sciences at 4.26.
Relatively lower scores were recorded by the Faculty of Medicine at 4.12, the Faculty of Sports Activities at 4.13, and the Faculty of Arts Studies at 4.01.
Overall, this indicator exceeded 4 points at every faculty, demonstrating that students assessed academic staff performance positively.
Organization of the Educational Process
The university-wide average score for the organization of the educational process was 4.16.
The highest score was recorded by the Faculty of Production Technologies, at 4.36.
The Faculty of Information Technology and Physics and Mathematics scored 4.26; the Faculty of Natural Sciences, 4.18; the Faculties of Psychology and Social Sciences and Sports Activities, 4.14 each; and the Faculty of Philology, 4.13.
The lowest scores were recorded by the Faculty of Arts Studies, at 4.02, and the Faculties of Digital Economy and Innovation and Medicine, at 4.07 each.
Assessment System and Academic Integrity
The university received a score of 4.39 in this area, making it one of the highest-rated indicators.
The highest score, 4.45, was recorded by the Faculties of Information Technology and Physics and Mathematics, Production Technologies, and Medicine.
The Faculty of Digital Economy and Innovation scored 4.40. The Faculties of Philology, Psychology and Social Sciences, and Natural Sciences each scored 4.37.
The relatively lowest score was recorded by the Faculty of Arts Studies, at 4.17.
Overall, these results indicate that students have a positive perception of the relative transparency of the assessment process, the clarity of assessment criteria, and the observance of academic integrity principles.
Learning Conditions and Infrastructure
The university-wide average score for learning conditions and infrastructure was 4.08.
The highest score was recorded by the Faculty of Production Technologies, at 4.31.
This was followed by the Faculty of Information Technology and Physics and Mathematics at 4.28, the Faculty of Natural Sciences at 4.19, the Faculty of Philology at 4.07, and the Faculties of Digital Economy and Innovation and Medicine at 4.05 each.
Relatively lower scores were recorded by the Faculty of Arts Studies at 4.00, the Faculty of Sports Activities at 3.89, and the Faculty of Psychology and Social Sciences at 3.73.
E-learning and Digital Systems
This was the highest-rated area across the university, with an average score of 4.61.
The faculty-level results were as follows: Faculty of Production Technologies — 4.73; Faculty of Information Technology and Physics and Mathematics — 4.65; Faculty of Philology — 4.63; Faculty of Natural Sciences — 4.61; Faculties of Psychology and Social Sciences and Medicine — 4.60 each; Faculty of Digital Economy and Innovation — 4.59; Faculty of Sports Activities — 4.46; and Faculty of Arts Studies — 4.34.
Overall Student Satisfaction
The university-wide score for overall student satisfaction was 3.95, the lowest among all assessed areas.
The highest score was recorded by the Faculty of Production Technologies, at 4.15.
The Faculty of Information Technology and Physics and Mathematics scored 4.04; the Faculty of Natural Sciences, 4.00; the Faculty of Sports Activities, 3.96; the Faculty of Philology, 3.91; the Faculty of Psychology and Social Sciences, 3.90; the Faculties of Digital Economy and Innovation and Medicine, 3.87 each; and the Faculty of Arts Studies, 3.83.
Overall Results by Faculty
| Faculty | Overall score |
|---|---|
| Faculty of Production Technologies | 4.41 |
| Faculty of Information Technology and Physics and Mathematics | 4.33 |
| Faculty of Natural Sciences | 4.27 |
| Faculty of Philology | 4.22 |
| Faculty of Digital Economy and Innovation | 4.20 |
| Faculty of Medicine | 4.19 |
| Faculty of Psychology and Social Sciences | 4.17 |
| Faculty of Sports Activities | 4.15 |
| Faculty of Arts Studies | 4.06 |
| University-wide average | 4.24 |
According to the overall results, the average score exceeded 4.0 at every faculty.
Three faculties scored above the university average: Production Technologies, with 4.41; Information Technology and Physics and Mathematics, with 4.33; and Natural Sciences, with 4.27. The Faculty of Philology scored 4.22, which was close to the university average.
Key Positive Findings
The overall university score was 4.24.
E-learning and digital systems received the highest student rating, at 4.61.
The assessment system and academic integrity received a high score of 4.39.
Academic staff performance was rated above 4 at every faculty.
The Faculty of Production Technologies demonstrated consistently high results across all major indicators.
Areas Requiring Attention
Overall satisfaction level — 3.95.
Learning conditions and infrastructure — 4.08.
Infrastructure score at the Faculty of Psychology and Social Sciences — 3.73.
Overall satisfaction at the Faculty of Arts Studies — 3.83.
Overall satisfaction at the Faculties of Digital Economy and Innovation and Medicine — 3.87 each.
Proposals and Recommendations
Conduct a separate faculty-level analysis of indicators scoring below 3.9.
Organize focus groups, interviews, and open discussions to identify the factors affecting student and master’s degree student satisfaction.
Conduct an inventory of educational infrastructure at the Faculties of Psychology and Social Sciences and Sports Activities.
Carry out an internal review of all major indicators at the Faculty of Arts Studies and develop an improvement plan.
Preserve existing good practices in e-learning and digital systems and extend them to other services.
Discuss academic staff performance assessment results at department meetings and identify the necessary methodological measures.
Regularly monitor student opinions regarding the assessment system and academic integrity.
Conclusion
The survey results indicate that students generally assess the university’s educational process and services positively. The university-wide average score of 4.24 provides evidence of this.
Particularly high scores were recorded for E-learning and Digital Systems, at 4.61, and the Assessment System and Academic Integrity, at 4.39.
At the same time, the overall satisfaction score of 3.95 and the learning conditions and infrastructure score of 4.08 indicate the need to continue systematic improvement in these areas.
It is recommended that the survey results be discussed at meetings of faculties and structural units. An action plan should be developed to address the identified shortcomings, specifying clear deadlines, responsible persons, and performance indicators. Subsequent monitoring should assess the effectiveness of the measures implemented.
Share on social networks
Recent Posts